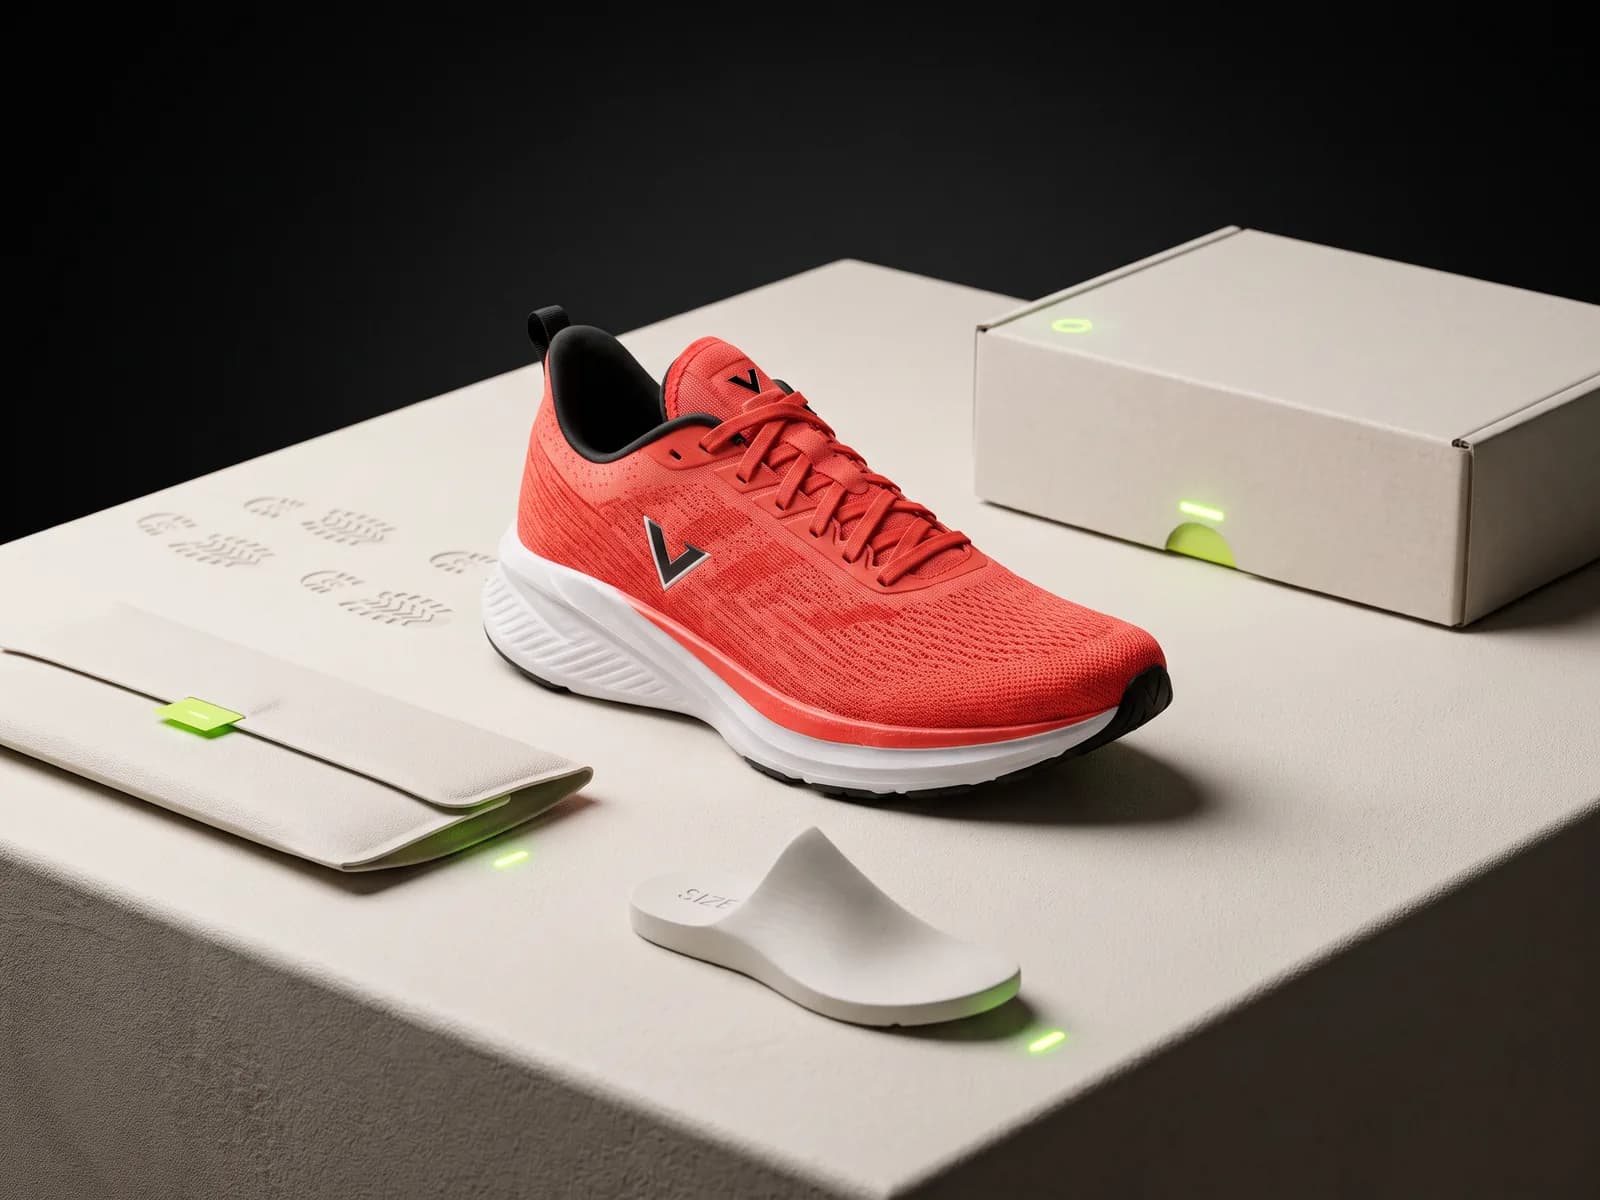
A sample workspace for Velocita, a running-shoe store. Everything below is one pass of the loop on one product page: the map, the diagnosis, the variant, the test, and what happens to the result.
Sample data — illustrative figures, not a customer result
01 — Connect
One script tag, then it reads the product.
Nothing changes on your site during this step. Gradient is only looking: which pages exist, how visitors move between them, and which components sit on the path to a purchase.
Discover routesEvery page and screen a visitor can reach, crawled the way a customer walks it.
Observe journeysWhich paths people actually take, and where they stop taking them.
Join behaviourAnalytics, session signals, and order data joined to a single exposure record.
Classify componentsEvery component sorted into experimentable, approval required, or protected.
02 — Map
Every surface, joined to what it's worth.
Each screen is matched to its traffic, its behavioural signals, its component count, and how close it sits to revenue. That ranking is what decides where to look first.
84components analysed
5journey surfaces joined
23components on the focus surface
Product detail carries the most traffic and the largest commitment gap. Its purchase block is the first safe target.
/
Home
Creates product discovery
Monthly traffic
18.4k
Components
16
/collections/running
Collection
Moves shoppers into evaluation
Monthly traffic
12.2k
Components
14
/products/pulse-3
Product detail
Primary purchase decision
Monthly traffic
42.0k
Components
23
/cart
Cart
Confirms order value
Monthly traffic
3.1k
Components
11
/checkout
Checkout
Completes the transaction
Monthly traffic
1.6k
Components
20
Detected focusMost purchase loss occurs between product detail and checkout.
03 — Classify
What it may touch is settled before it proposes anything.
Every component gets one of three classes. Protected components are never experimented on, whatever the opportunity looks like. You can move any component into a stricter class at any time.
Product storyPrice and offerCheckout logic
04 — Diagnose
Find the drop-off, then find its cause.
The funnel says where people leave. The diagnosis says why, and names the component responsible. Opportunities are then ranked on evidence, revenue proximity, and how risky the change is.
Sample mobile funnel
Product viewed100%
Size selected61%
Checkout started29%
Purchase completed18%
Observed evidence
Reassurance appears after commitment begins.
Delivery and exchange confidence sit below the size and purchase controls on the current mobile page.
Affected audience
First-time mobile visitors
Critical component
Primary purchase block
Permission
Experimentable
01
Resolve delivery doubt at the action
EvidenceStrong
ImpactHigh
RiskLow
02
Restore returning visitor configuration
EvidenceMedium
ImpactHigh
RiskLow
03
Clarify total delivery cost earlier
EvidenceMedium
ImpactMedium
RiskApproval
04
Reorder performance proof
EvidenceEarly
ImpactMedium
RiskLow
05 — Build
Real alternatives, with the original preserved.
Each variant is a different answer to the same diagnosis. Your existing component keeps running as the control, and price, cart, and checkout are untouched in all of them.
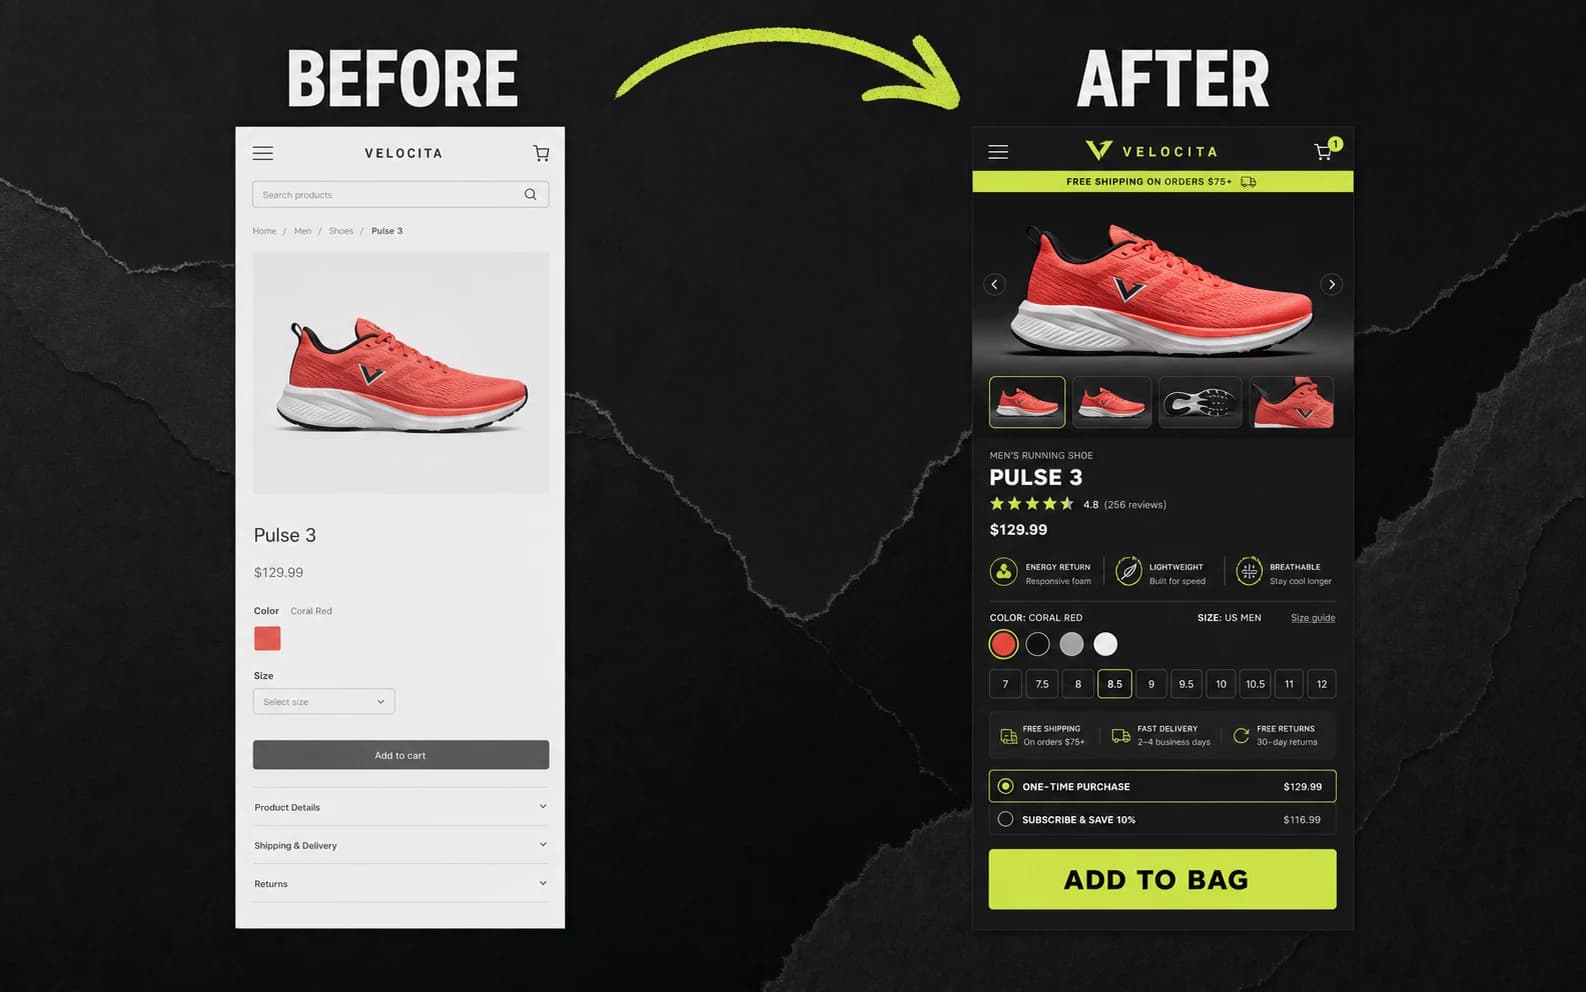
BeforeCurrent purchase block
Delivery and exchange reassurance sit after the commitment point.
Improved componentVariant B: Decision first
Pulse 3$129.99
Remove doubt at the action.
Reviews, fit confidence, delivery, exchanges, and size selection become one compact decision block.
Fit confidenceDelivery dateFree exchange policy
US 8US 8.5US 9
06 — Test
Launch on a contract, watch the guardrails.
Before any traffic moves, the change, the audience, the traffic share, the stop conditions, and the rollback path are all agreed. Then the numbers decide.
TreatmentVariant B
AudienceFirst-time mobile visitors
Primary measurePurchase conversion
Initial traffic10% sample
Automatic stopConversion loss or guardrail breach
RollbackOriginal component preserved
Purchase conversionVariant B separates from control
Example cumulative rate, seven days
9%8%7%
Variant B 8.6%Control 8.0%18,420 users exposed
Guardrail health4 checks inside limits
Checkout errors0.18%under 0.50%
Refund requests2.7%under 3.2%
Average order value$124.20above $119
Page load p752.1sunder 2.5s
A breach pauses traffic and restores the preserved control component.
Identity + experiment joinOne cohort, one exposure record
OutputDecision, evidence, errors, and rollback state
This is a sample integration contract, not a claim that every connector is installed. Real coverage depends on what your stack already emits.
07 — Keep
Promote it, or revert it and keep the lesson.
A winner is promoted and the holdback keeps measuring it. A loser is reverted without a deploy. Either way the result is written down, so the next test does not re-learn it.
Sample winner
Variant B
Decision first
Confidence signals beside configuration will improve add-to-bag completion.
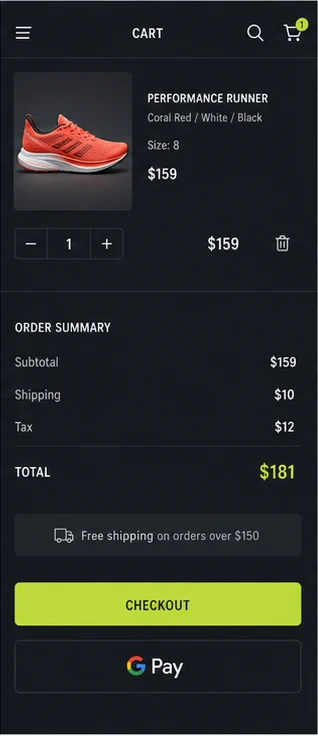
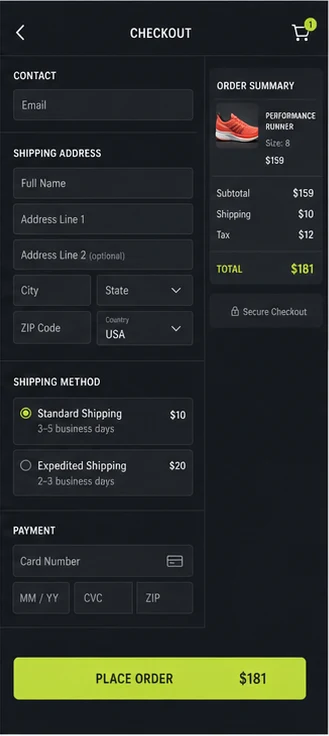
 Product storyPrice and offerCheckout logic